


U.S. home prices are falling in these markets
Real Estate Insights by Snapforce | Reverse Market Insight’s Neighborhood Dashboard
Housing prices across the U.S. are receding from their pandemic highs. This week we will show you how to identify those markets which may present fewer pricing challenges to help you better direct your energy and marketing dollars.
Reverse mortgage professionals are typically occupied with the movement of the 10-year Constant Maturity Treasury rate which in part determines just how much money a HECM borrower may qualify for. However, tracking housing market trends where you originate is not always as simple. It’s natural to ask’ where do I begin’? More importantly, where am I more likely to see home values declining? To answer that we’re going to share with you a tool I came across on the YouTube channel RJ Talks. Real Estate Insights from SnapForce. It only costs $12 a month and we’ve included a link below this video.
But before we dive in a word of caution on the media’s real estate reporting.
Read More
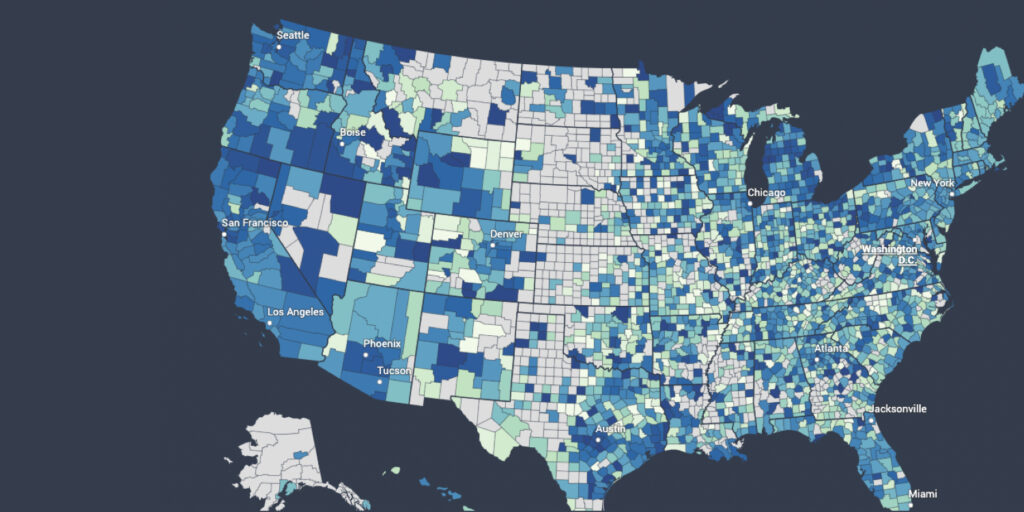
When you hear reports from Zillow, Redfin, and others saying that the housing market has stabilized you should ask how? More importantly, where? That is in which specific market? Many of the real estate talking heads in the media are telling us that the worst of the housing reset, recession, or crash (whichever you prefer to call it) is behind us. But does the data support their statements? To answer that question let’s go to Real Estate Insights to examine the median home prices in California, which accounted for 26% of all Home Equity Conversion Mortgage endorsements in 2021, and also select metros in Arizona, and Texas. This data set tracks median home prices from June 2022 through January of this year and also month-over-month changes. First, let’s go to Alameda County, California. Here home values have fallen by 25% from a peak of $1.4 million in June to just over $1 million in January according to data from the California Association of Realtors and the U.S. Census Bureau. That’s a drop of over $350,000 in seven months! So what’s driving home prices down in Alameda County and other metros across the country? In one word, affordability. For example, the median household income in Alameda county is $113,518. Assuming a 20% down payment the monthly payment on a 30-year fixed-rate mortgage would be $5,686 before any property taxes and insurance are accounted for. Keep in mind this assumes the current average interest rate on a 30-year fixed-rate mortgage of 7.03%; a rate for which few may qualify. That means the principal and interest payments alone would account for over 60% of the median household income in Alameda County! Is that affordable? Likely not. Santa Barbara County median home prices are down nearly 29% from peak to trough during the same time period falling 13% in one month from December to January. There the typical 30-year mortgage would require 66% of the county median income. As we move over the map note that the counties in light green and light blue are seeing more moderate drops in home prices, yet nearly every market is showing a reduction. Perhaps these are areas where originators may find fewer applicants being short-to-close. On a side note, in San Francisco, the impacts of Big Tech layoffs and public safety issues can be clearly seen. San Francisco County has seen its median home price fall over 27% since last June but more shocking is the 10% drop in one month from December to January. However, Marin County California takes the prize for the biggest price drops with a 33% median home price reduction of over 33% peak to trough and a 17% drop from December to January. Today home prices in Marin County are only 4.48% above pre-pandemic prices in January 2019. Next, Arizona. The Phoenix-Mesa-Chandler metro median home listing prices have fallen by over ten percent. To better illustrate the affordability crisis created by inflated home values and high-interest rates let’s go back in time. In December 2018 the median home list price near Phoenix was $231,600. Using the average 30-year mortgage rate of 4.5% in 2018 such a home would require principal and interest payments of approximately $943 a month. Today that same home at today’s prices and interest rates would cost nearly $2,100 a month. That’s a 122% increase! There’s much talk in the real estate world about Austin Texas. Nearby metros there have seen price drops of 12-18% peak to trough since last June. Zooming out nationally you’ll see that the formerly hottest real estate markets are seeing the biggest price drops; mostly concentrated on the west and east coasts and the southwest. So what’s the point of this exercise? First, knowing your markets is crucial to increasing your odds of finding potential borrowers who are likely to qualify. Second, home prices, in my opinion, will continue to fall until they become reasonably affordable for area homebuyers. That likely will mean prices returning to pre-pandemic levels. Case in point- Riverside County California is still 46% above the median home price in January 2019. And if we scroll down to the Great Recession and housing crash of 2008 we can see that it took 13 years for home prices to brush against 2006’s high-water mark of 416,000. I would encourage our viewers who want to know more about their markets to utilize Reverse Market Insight’s Neighborhood Dashboard to determine the best areas for your marketing efforts and Real Estate Insights to see which markets have more stable home prices. We’ve included links to both of these tools below. Share your feedback if you choose to use either of these tools or presently are using something similar in the comment section below.


3 Comments
Great information where did you say that I could see all the national averages ?
Here’s a link to the tool used to find specific county data across the country. National averages may be found on Realtor.com’s data publications.
https://app.snapforce.com/prodigy/checkout.php
[…] the tool we use to look at the macro and local market housing trends. This tool was featured in our February 27th broadcast of the Industry Leader Update. Those wishing to research their markets can subscribe to Snapforce for $12/month […]